
Increase your productionof aha moments.
Use your operational time series data to make your business more efficient, profitable and sustainable.
Watch Our Product Tour
Turn your sea of data into a fountain of knowledge
Your manufacturing data is a terrible thing to waste. It’s also a terrible thing for your team to spend their time and money wading through when there’s an easier way. Seeq can help.
Teach your data new tricks
With the help of Seeq’s advanced analytics, ML & AI platform and our team of industry experts, you can use your time series data to get answers and discover opportunities in near real-time. We’re talking days vs months. That way you can:
production runs
sustainability goals
your experts
Access. Discover. Share. So engineers can solve, improve, predict.
- Seeq AI Assistant
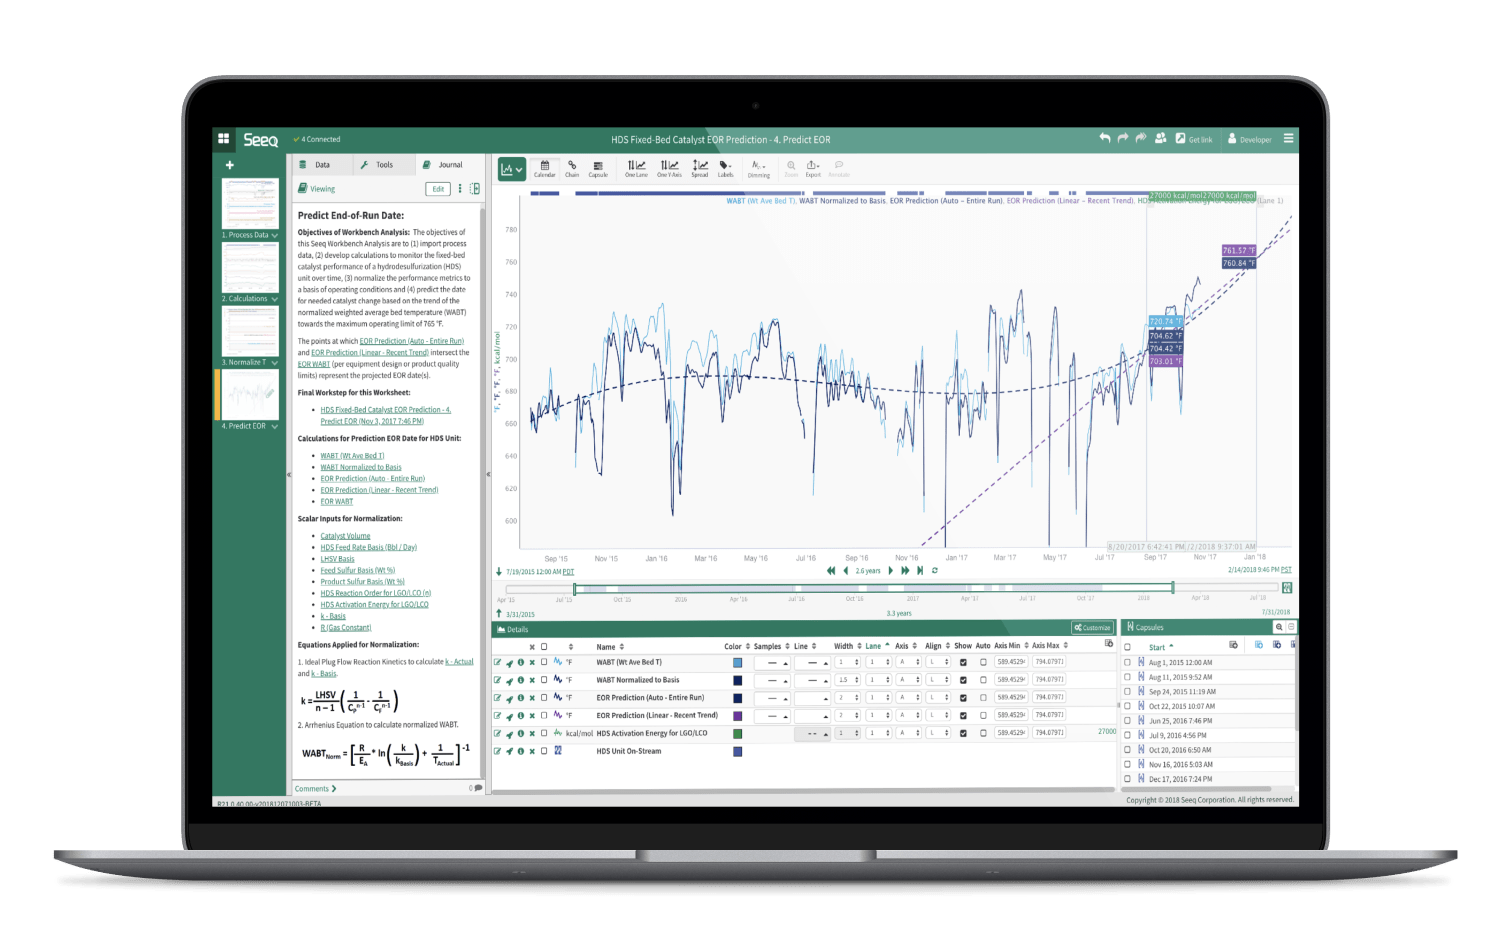
- Seeq Workbench
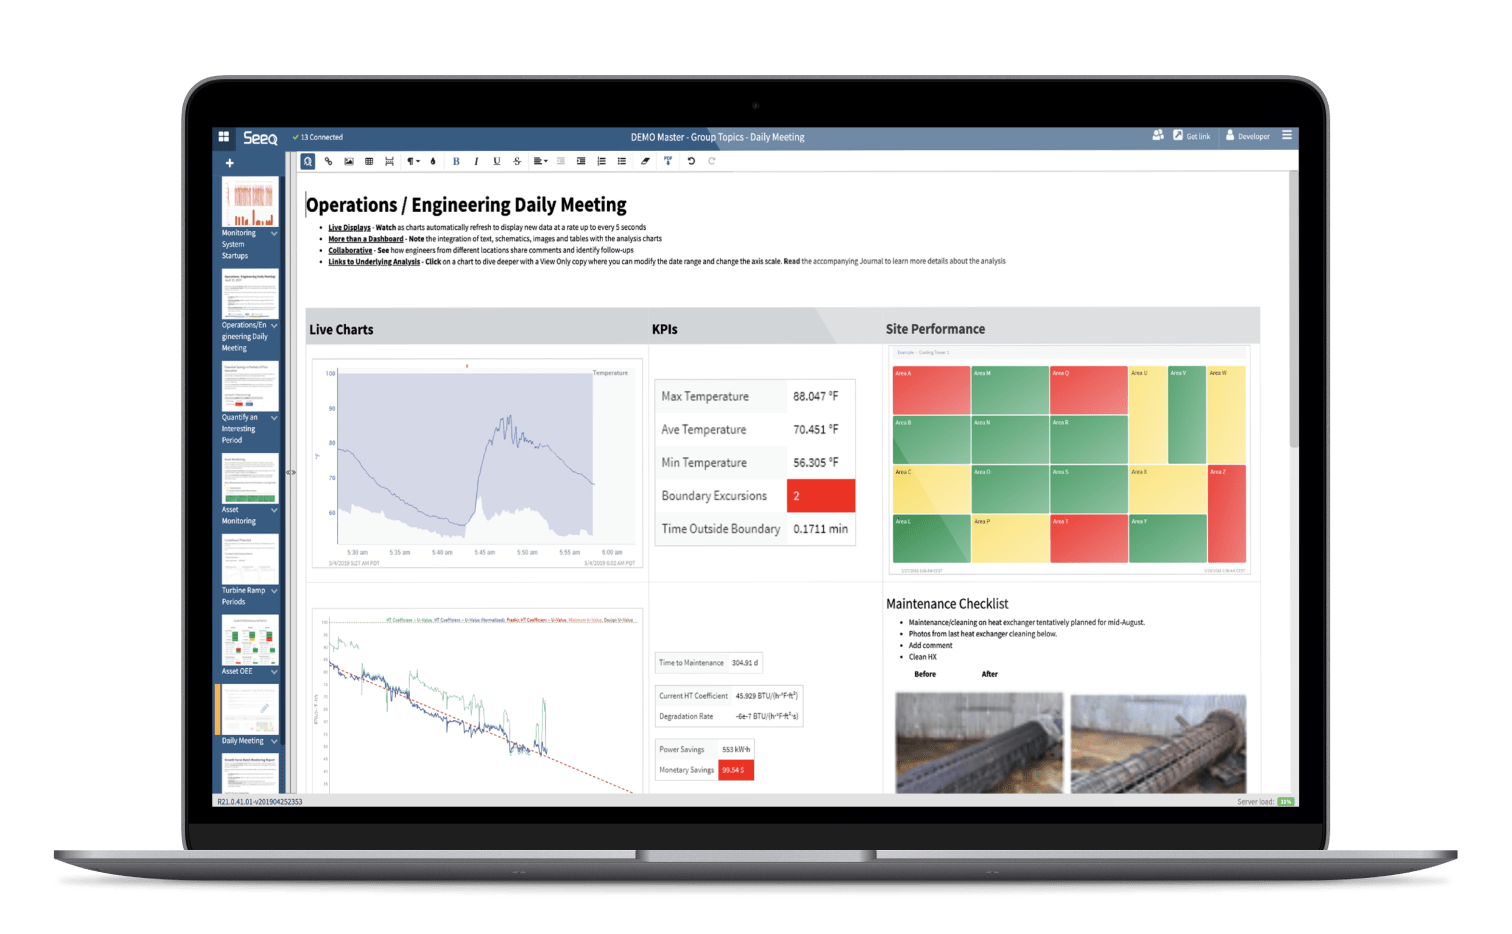
- Seeq Organizer
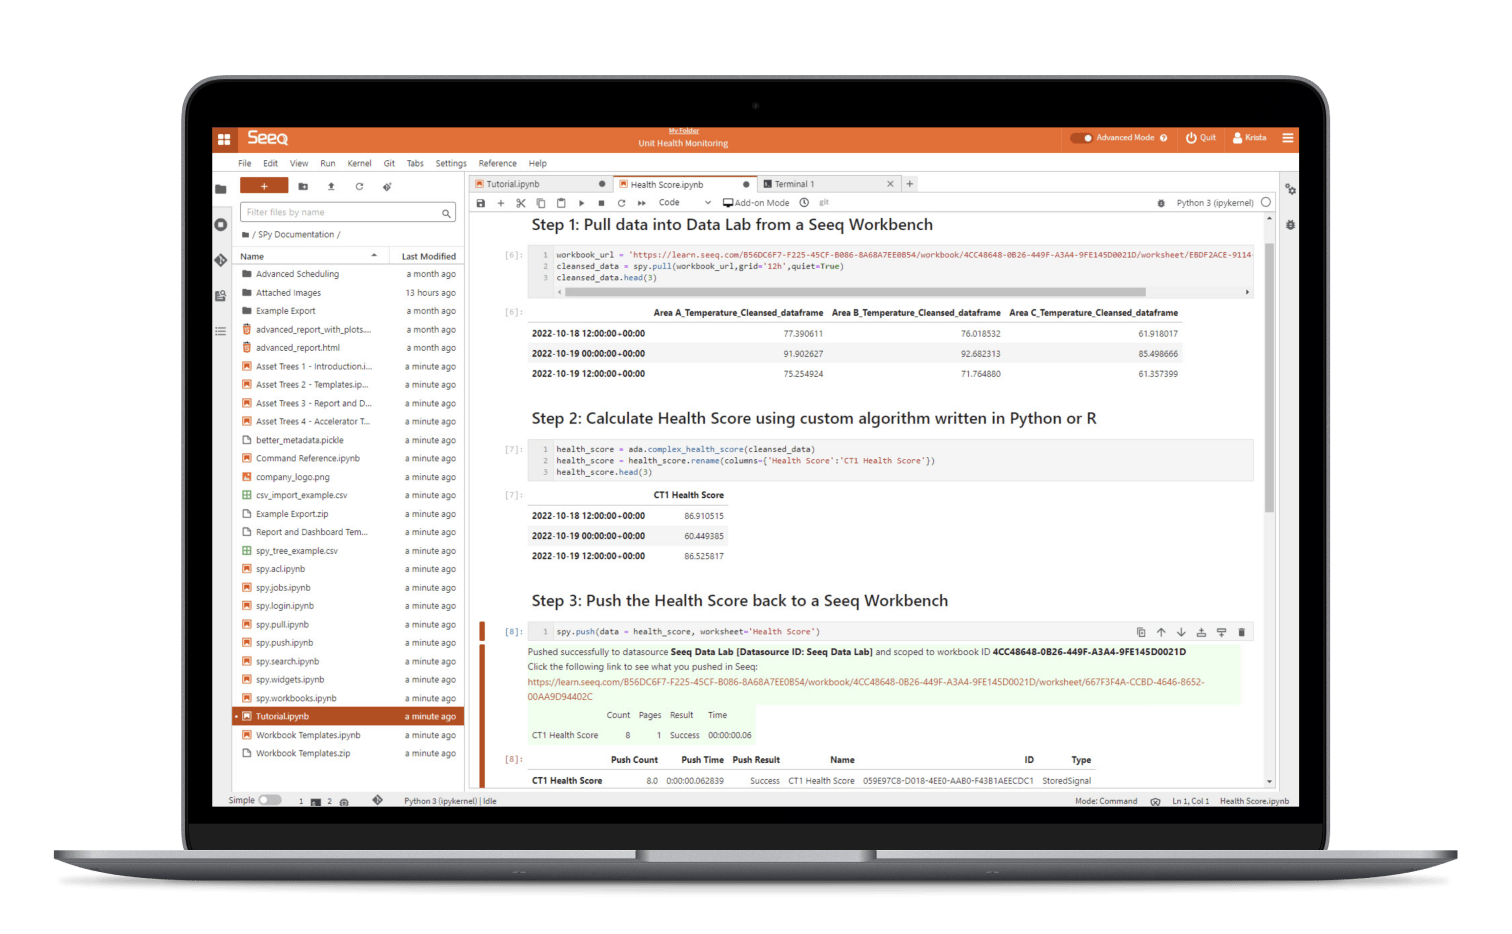
- Seeq Data Lab
Solutions as unique as your company
Whether you're the CEO, a data scientist, an operations manager, or an engineer, Seeq is all about making your job easier—and your business more successful.

We have experience across a wide range of industries and solutions tailored to your needs.
Your success is our success.
We have deep industry experience and have made incredible contributions across a range of manufacturing companies.

Learn to Seeq


Thanks for all the thanks.


